Inflation Salary Calculator
What is a salary from 2000 actually worth in 2026? Enter any year back to 1913 and see today's equivalent using official BLS Consumer Price Index data — plus how much you'd need to earn now to match that purchasing power and how much value you've lost to inflation if your pay stayed flat.
All inputs adjust the result in real time. No data leaves your browser.
CPI 2026: 330.2
Multiplier: 1.918×
Period: 26 years
Year-by-Year Purchasing Power
| Year | CPI-U | Real Value of $50,000 | Salary Needed to Match 2000 |
|---|---|---|---|
| 2000 | 172.2 | $50,000 | $50,000 |
| 2002 | 179.9 | $47,860 | $52,236 |
| 2004 | 188.9 | $45,580 | $54,849 |
| 2006 | 201.6 | $42,708 | $58,537 |
| 2008 | 215.3 | $39,990 | $62,515 |
| 2010 | 218.1 | $39,485 | $63,315 |
| 2012 | 229.6 | $37,501 | $66,665 |
| 2014 | 236.7 | $36,370 | $68,739 |
| 2016 | 240.0 | $35,874 | $69,688 |
| 2018 | 251.1 | $34,288 | $72,911 |
| 2020 | 258.8 | $33,268 | $75,148 |
| 2022 | 292.7 | $29,420 | $84,975 |
| 2024 | 313.7 | $27,448 | $91,083 |
| 2026 | 330.2 | $26,075 | $95,877 |
Frequently Asked Questions
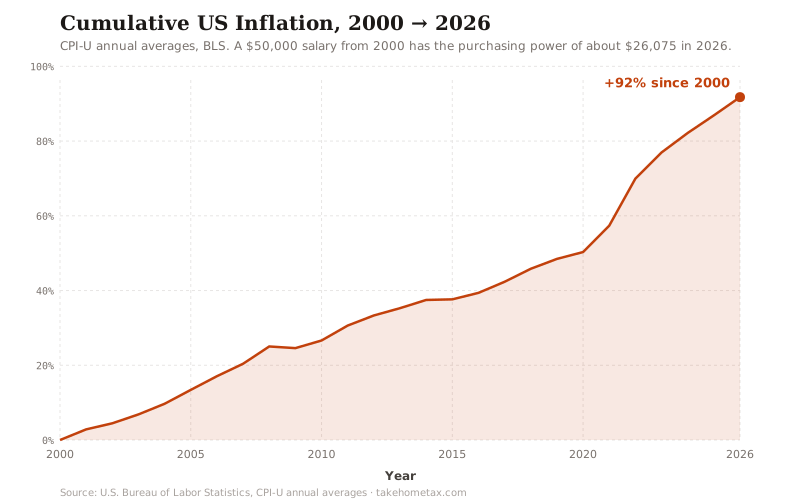
Inflation is the silent tax on every paycheck. A salary that felt comfortable five, ten, or twenty years ago purchases dramatically less today — and most workers don't realize how much ground they've lost because the headline number on their paystub never changes. This calculator quantifies that gap using the official Consumer Price Index for All Urban Consumers (CPI-U), the same index the U.S. Bureau of Labor Statistics uses to measure inflation across the economy.
The math is mechanical. To convert a past salary into today's dollars, multiply by the ratio of the current CPI to the CPI in the starting year. A $50,000 salary from 2000 (CPI 172.2) translates to roughly $95,900 in 2026 dollars (CPI 330.2) — meaning your old salary had nearly twice the purchasing power it would have if you earned that same $50,000 today. The flip side of that ratio shows what your old salary is now worth in real terms: that 2000 $50,000 buys what about $26,055 buys in 2026.
Cumulative purchasing power lost compounds in a way that surprises people. If your nominal salary stayed exactly flat from your starting year through today, the cumulative shortfall — the year-by-year gap between what you earned and what you would have needed to maintain your starting purchasing power — adds up to many multiples of a single year's salary. Twenty-six years of flat $50,000 earnings since 2000 produces a cumulative inflation gap of more than $400,000 in lost real income. That's the implicit pay cut you took by not getting inflation-matching raises.
Average annual inflation across multi-decade spans tends to look smaller than recent memory suggests. From 1990 to 2026, the U.S. averaged about 2.6% annual inflation. From 2000 to 2026, the average is closer to 2.5%. From 2020 to 2026 — the COVID and post-COVID inflation shock — the average is closer to 4.1%, with 2022 hitting 8.0% on its own. The CPI-U dataset in this calculator captures all of that variation, year by year, so your result reflects the actual path inflation took rather than a smooth assumption.
Why this matters for your career and negotiations: every job offer, every annual review, every raise should be measured against the inflation baseline. A 2% raise during a year with 3% inflation is a 1% pay cut in real terms. A flat year — no raise at all — is a full-inflation pay cut. Workers who have stayed in the same role for five or more years without robust raises have almost certainly lost ground to inflation, often without realizing it. This tool puts a hard dollar number on that gap so you can use it in your next negotiation or career decision.
The CPI-U has limitations worth knowing. It tracks a fixed basket of consumer goods and services and updates the basket periodically. It doesn't capture every individual's personal inflation rate — if you spend disproportionately on housing in a high-cost city, your true inflation rate is higher than CPI-U; if you spend less on cars and more on services, your rate may differ in the opposite direction. The Personal Consumption Expenditures (PCE) price index used by the Federal Reserve typically runs 0.3 to 0.5 percentage points below CPI-U. For salary purposes, CPI-U is the standard reference because employers and economists use it as the wage-inflation benchmark.