Monday, July 6, 2026·2026 Edition
AboutMethodologyContact
The TakeHomeTax
Home/Calculators/Tax Planning Calculators
Tax Planning Calculators

Tax Bracket Visualizer

See exactly how your income flows through each federal tax bracket. Understand the difference between your marginal rate and effective rate at a glance.

By NumbersLab Editorial·Updated for 2026 tax year·Editorial standards
Tax bracket visualization with rising bars — representing interactive flow of income through federal and state brackets
Photo by Lukas Blazek on Unsplash
Interactive Calculator

All inputs adjust the result in real time. No data leaves your browser.

Tax Year
$
Standard Deduction: $16,100 | Taxable Income: $78,900

Federal Income Tax Brackets

10%$1,240
12%$4,494
22%$6,391
Total taxable income: $78,900
10%
$0 \u2013 $12,400
$12,400
$1,240
12%
$12,400 \u2013 $49,850
$37,450
$4,494
22%
$49,850 \u2013 $78,900
$29,050
$6,391
Total Federal Tax
$12,125

Effective Rate

29.1% tax
70.9% take-home
Of every dollar earned, you keep 70.9% after all taxes

State Tax: California

8.6% effective (graduated)
1-13.3% | State tax: $8,213
Total Tax / Effective Rate
$27,605 / 29.1%Moderate tax burden
$5,616/month take-home
Federal Tax
$12,125
12.8% effective
FICA
$7,268
7.6% of gross
State Tax
$8,213
8.6% effective
Take-Home
$67,395
$5,616/mo
Marginal Rate
Your next dollar of income is taxed at the federal 22% bracket + state tax
22%
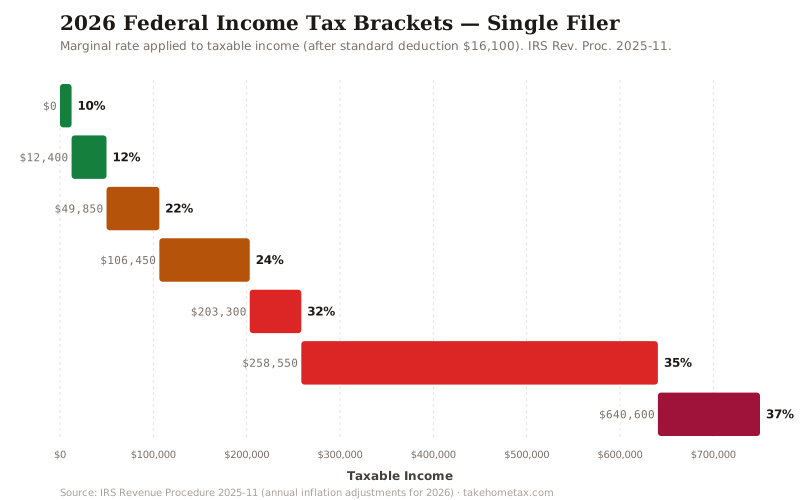
2026 federal income tax brackets for single filers showing marginal rates from 10% to 37% across taxable income from $0 to $750,000
Figure. The 2026 federal marginal tax brackets for single filers. The 22% bracket spans the largest income range ($49,850–$106,450), so most middle-class filers spend years adding income inside it.Source: IRS Revenue Procedure 2025-11
The Background

The U.S. federal income tax system uses progressive brackets. This means your income is not all taxed at one rate. Instead, each portion of your income is taxed at an increasing rate as you earn more. The first dollars you earn are taxed at the lowest rate (10%), and only the income above each threshold is taxed at the next higher rate.

Your marginal tax rate is the rate applied to your last dollar of income — the highest bracket you reach. Your effective tax rate is the total tax you pay divided by your total income, which is always lower than your marginal rate because those first dollars were taxed at lower rates.

The standard deduction reduces your taxable income before brackets apply. For 2026, the standard deduction is $16,100 for single filers and $32,200 for married filing jointly. This means if you earn $95,000 as a single filer, only $78,900 is actually subject to federal income tax.

State income taxes add another layer. Some states use a flat rate (one percentage for all income), while others use graduated brackets similar to the federal system. Nine states charge no income tax at all. Combined with federal taxes and FICA, your total effective rate determines your actual take-home pay.

More in Tax Planning Calculators
Browse all tax planning calculators
The Full Index
PaycheckFreelance TaxOvertime (OBBBA)Quarterly EstimatesBonus TaxW-4 WithholdingTax RefundStock OptionsRSU TaxSelf-EmploymentSide IncomeRetirementSalary → HourlyHourly → SalaryMarriage TaxRelocationCost of LivingEmployer CostCapital Gains1099 vs W2Social SecurityPaycheck PlannerSalary NegotiationRetirement PlannerSide HustleTotal CompAMT TriggerCharitable GivingWithdrawal SequencerTrue Marginal RateTax Cliff MapRMD ForecasterSS Claiming AgeLump Sum vs AnnuityInherited IRARMDInflation SalaryRoth vs Traditional 401kHSA Triple-Tax401(k)
Was this calculator helpful?
The Take-Home Tax Guide
Weekly tips on reducing your tax burden, state tax changes, and salary negotiation strategies. Free.